
Global GDP Crosses $128 Trillion in 2026 as AI Boom and Energy Shock Reshape Economic Order
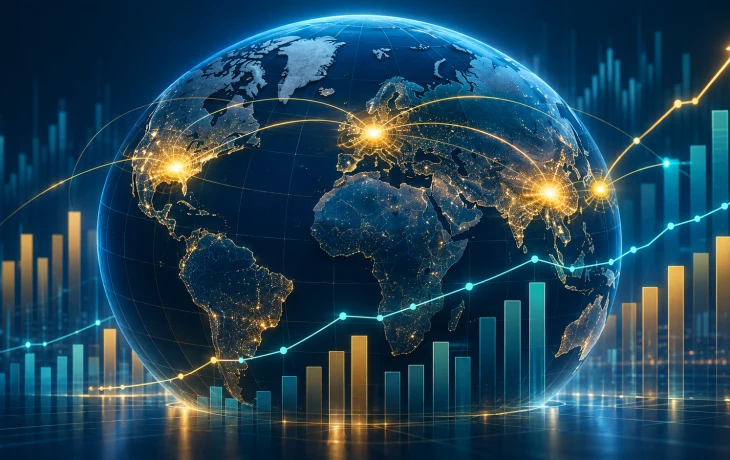
TheWorldBank’sindicatorforGDP(currentUS) shows that global output stood at $118.35 trillion in 2025 before the projected jump, with the United States and China alone accounting for more than 42 percent of the total, a concentration that shapes everything from trade policy to corporate strategy. As of November 5, 2026, the headline number tells a story of resilience—but beneath it, a war-driven energy shock and an artificial-intelligence investment boom are redrawing the map of who produces what, and at what cost.
The $128 Trillion Headline: What It Actually Means
The IMF’s October 2026 World Economic Outlook puts global GDP at more than $128 trillion measured in current U.S. dollars, a figure that represents roughly a $20 trillion increase compared with 2023. That nominal growth is not purely a story of expansion: part of the increase reflects inflation and exchange-rate movements, particularly the strength of the dollar against emerging-market currencies.
The World Bank’s own data, which tracks GDP in current U.S. dollars, shows global output at $118.35 trillion in 2025—6 percent higher than in 2024—before the IMF’s 2026 projection. The discrepancy between the two figures is less a contradiction than a reflection of methodology and timing: the World Bank’s figure is a historical estimate, while the IMF’s $128 trillion is a forecast shaped by assumptions about oil prices, trade flows, and investment.
What matters for policymakers and executives is not the absolute number but the composition. Just four economies—the United States, China, Germany, and Japan—generate roughly half of all global economic activity. That concentration is not new, but the environment around it is: the IMF expects global growth to slow from 3.5 percent in 2025 to 3.1 percent in 2026, with headline inflation rising to 4.7 percent.
The AI Boom and the Energy Shock: Two Forces, One Economy
Two forces dominate the 2026 economic landscape, and their interaction explains much of the divergence between winners and losers.
The first is artificial intelligence. AI investment is supporting the economies best placed to supply it—primarily the United States, which is projected to grow 2.3 percent in real terms in 2026, and to a lesser extent China, which leads the four largest economies with projected growth of 4.4 percent. The AI boom is not evenly distributed: it benefits capital-exporting economies with strong technology sectors and deep financial markets, while leaving commodity-dependent economies more exposed to swings in energy prices.
The second is an energy shock driven by conflict in the Middle East, which has disrupted shipping through the Strait of Hormuz. The IMF now assumes oil will average about $96 a barrel in 2026, a price level that inflates the dollar value of commodity exporters—Russia’s GDP, for instance, is projected at $2.86 trillion, placing it eighth globally, ahead of Italy and Brazil—while squeezing import-dependent economies and contributing to the inflation uptick.
For executives allocating capital, the rankings now say as much about exposure to these two forces as about size. A country with a large nominal GDP may be riding an energy price windfall rather than a productivity boom, and a country with a smaller nominal GDP may be growing faster in real terms.
The Conversion Gap: Why Dollar Rankings Mislead
One of the most important insights from the 2026 data is the gap between GDP measured at market exchange rates and GDP measured at purchasing power parity (PPP). The two tell different stories, and confusing them leads to bad strategy.
At market exchange rates, the United States remains the world’s largest economy at $32.64 trillion, accounting for about 25.5 percent of global GDP. China follows at $21.55 trillion, or 16.8 percent. Germany ($5.47 trillion), Japan ($4.34 trillion), the U.K. ($4.27 trillion), India ($4.06 trillion), and France ($3.55 trillion) complete the top tier. On this basis, the U.S. economy is larger than the next five economies after China combined.
On a PPP basis, the picture changes sharply. China’s 2026 output is estimated at $44.6 trillion in international dollars, about 36 percent larger than the United States. India moves from sixth to third at $19.2 trillion, nearly three times Germany. Russia climbs to fourth, and Indonesia jumps from 17th to seventh at $5.5 trillion. This “conversion gap” matters because it reveals where domestic markets are large and cheap to serve—and where dollar rankings understate real economic weight. For companies deciding where to build, hire, or sell, the PPP lens is often more useful than the nominal one.
What to Watch in 2027 and Beyond
The IMF expects global growth to recover modestly to 3.4 percent in 2027, but the risks are tilted to the downside. A prolonged conflict in the Middle East that damages energy infrastructure could keep oil prices elevated and slow growth further. A sharper-than-expected slowdown in China’s property sector could ripple through commodity exporters. And the AI investment boom, while supportive in the short term, carries its own risks if capital spending outpaces productivity gains.
For now, the $128 trillion global economy is a testament to resilience—but also a reminder that headline numbers can obscure as much as they reveal. The countries and companies that thrive in 2027 will be those that look past the nominal figure and understand the forces underneath it: energy, technology, exchange rates, and the purchasing power of real people in real markets.